


Ulysses HISCALE Data Analysis Handbook
Appendix 16. LAN PHA Documentation (continued)
A16.5 Displays and Plots
This section describes the display and plots currently available in the LAN PHA system. There are three groups of PHA plot software - one for each output type from PHAGEN. In addition, there is an archive file display program for viewing rate channel data. The plots described in this section were developed in the VAX/VMS environment using XWindows. The actual implementation of the graphics software is installation dependent.
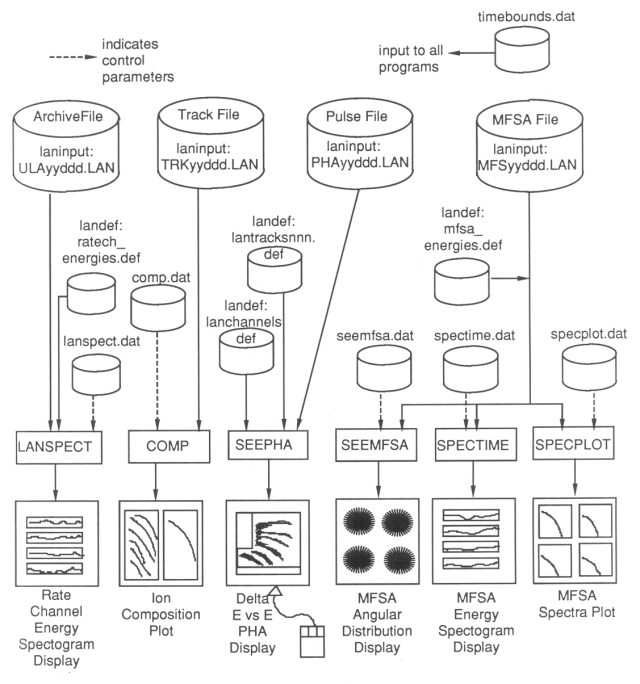
The LAN plots and color display system is shown below. The display system is designed to run with minimal operator keystrokes. Most programs will acquire any needed selections and bounds information using various control files. The user will set up a control file for each plot containing desired selections (species, energy ranges, count rate scales, etc.). These control files are normal ASCII files which may be easily edited. If the selections rarely change, the user is not required to supply the parameters each time the program is executed. The time bounds for each run are acquired in the same manner as with the PHAGEN program. That is, time bounds are maintained in the ASCII file "timebounds.dat." Each program will read the default time bounds from this file and give the user the option of using the default times or specifying different time bounds for the run. During event analysis when concentrating on one time period, the user need specify the time bounds only once and all programs will use these as the default time bounds (until they are changed again).
Figure A16-6 LAN plots and color displays
A16.5.1 Track Data Set Analysis
Presently, there are two tools for the track data set analysis:
- Species composition plot
- Track data formatted dump
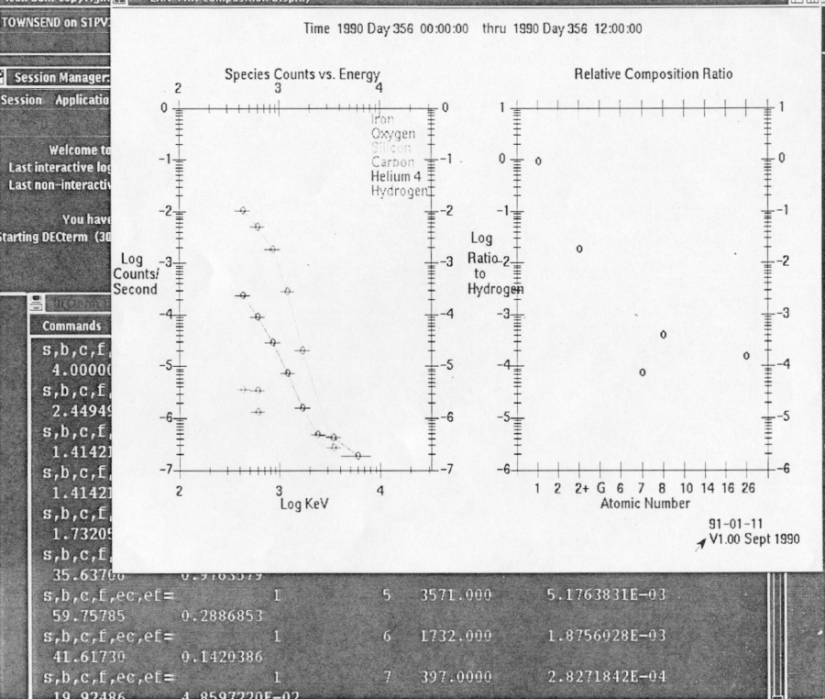
The species composition plot program for the track data set is named COMP. For each track record within the user specified time bounds, two plots are generated (see Figure A16-6). The first plot contains species log count rate versus energy for six user specified species. The count rate scale is set by the user in the control file (see below). If a sectored species is selected to plot, the user has the option of plotting all sectors for the species or the total of all sectors. The second plot contains the log ratio of each of the 11 species count rates versus a user specified species (typically oxygen). Again, the ratio scale is set by the user in the control file COMP.DAT.
Figure A16-7 Sample plots of track sums and LANSPECT
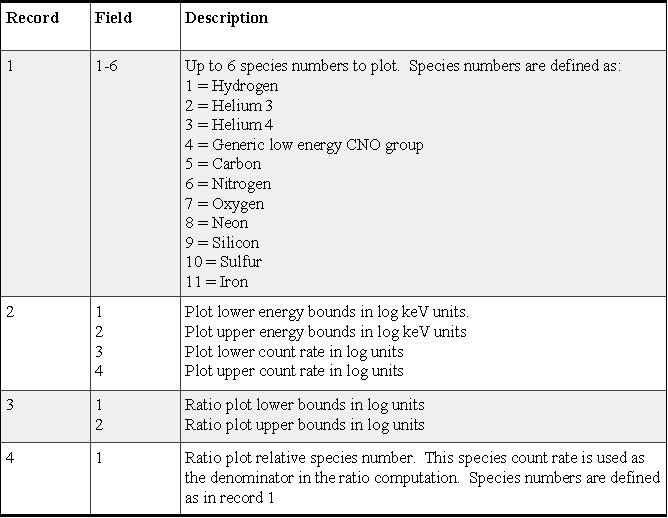
Input parameters to program COMP are specified in the file named COMP.DAT located in the run time default directory. The file contains the following records and fields:
Table A16-3 COMP.DAT definitions
The program TRACKDUMP will produce formatted ASCII listings of selected species track data. This program prompts the user for the desired species (deviating somewhat from the other analysis programs). In addition, the user may request the undefined event counts. The output listing is written for Fortran unit 7. In the VAX/VMS environment, this produces a file named "for007.dat" in the default run time directory. This file may be inspected, edited, and printed. In addition, the file may be used as input to other plot software.
A16.5.2 Pulse Data Set Analysis
There is presently only one tool available for the analysis of the pulse data set:
Delta E vs. E display and inquiry
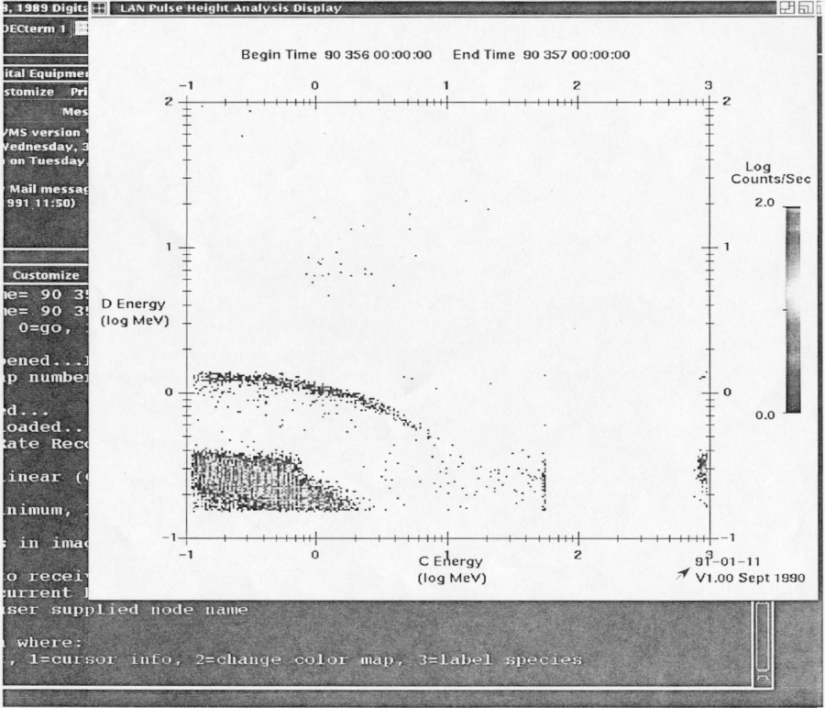
The delta E vs. E display and inquiry is performed by program SEEPHA. For each pulse record within the user specified time bounds, a display is generated and the user may make inquiries as to the contents of the display. The display format (Figure A16-8) is organized in the familiar delta Energy D (vertical scale) versus resultant Energy C (horizontal scale) format showing color encoded, normalized count rates for the entire 256 x 256 pixel space of the CA experiment. The program prompts the user for the initial color mapping (i.e., count rate scale) and allows the user to subsequently change the color mapping. In addition, SEEPHA allows the user to make inquiries into the display using a mouse interface. The user points to the desired location within the display and the program prints all information associated with the chosen pixel. Specifically, for each pixel selected for inquiry, the program lists the pixel location (C,D pair), the energy bin containing the pixel, the energy per nucleon of the pixel, the instrument channel id for the pixel, the derived species type (if defined) and the normalized count rate for the pixel.
Figure A16-8 Sample PHA matrix plot
A16.5.3 MFSA Data Set Analysis
Currently there are three tools available for the analysis of the MFSA data set:
- Angular distribution display
- Energy vs. time spectogram
- Spectra plot display
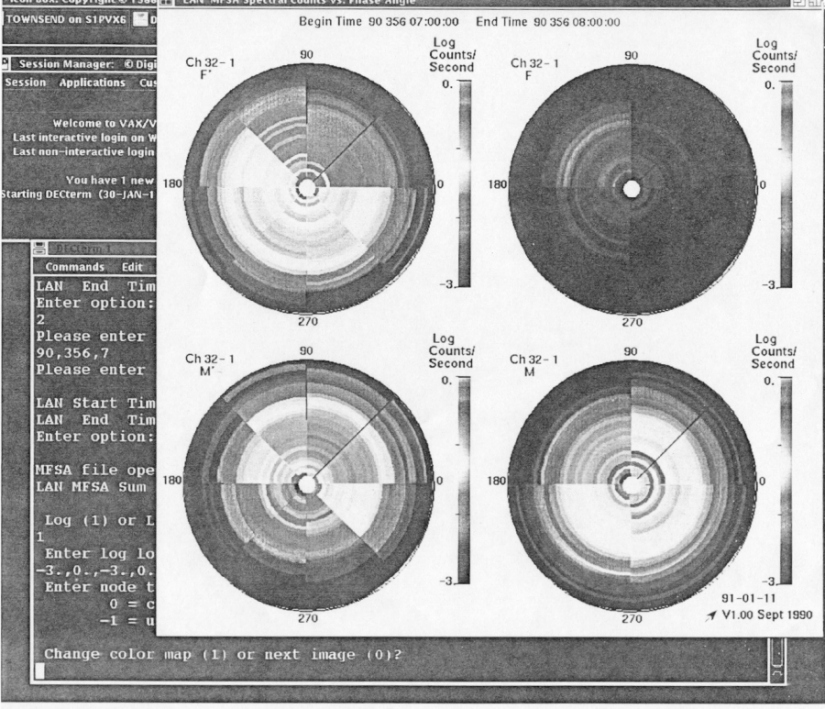
Program SEEMFSA generates an angular distribution display of normalized count rates for the user selected times and channels from the MFSA data set. The display format (Figure A16-9) contains four circular style plots-one for each detector M', M, F', and F. Sectors are plotted according to the sector phase angle. Detectors M' and F' contain eight sectors; detectors M and F contain four sectors. Each sector contains color encoded count rates for all detector channels organized radially inward from low channel (min 1) to high channel (max 32). The color scaling and the channel bounds are set by the user in the control file named SEEMFSA.DAT located in the run-time default directory. The file contains the following records and fields:
Table A16-4 Definition of SEEMFSA.DAT
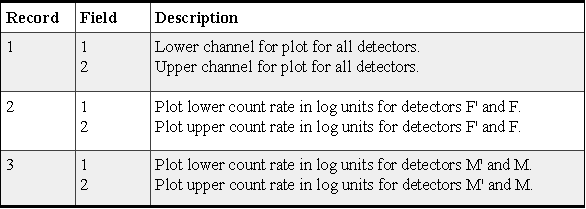
Figure A16-9 Sample SEEMFSA plot
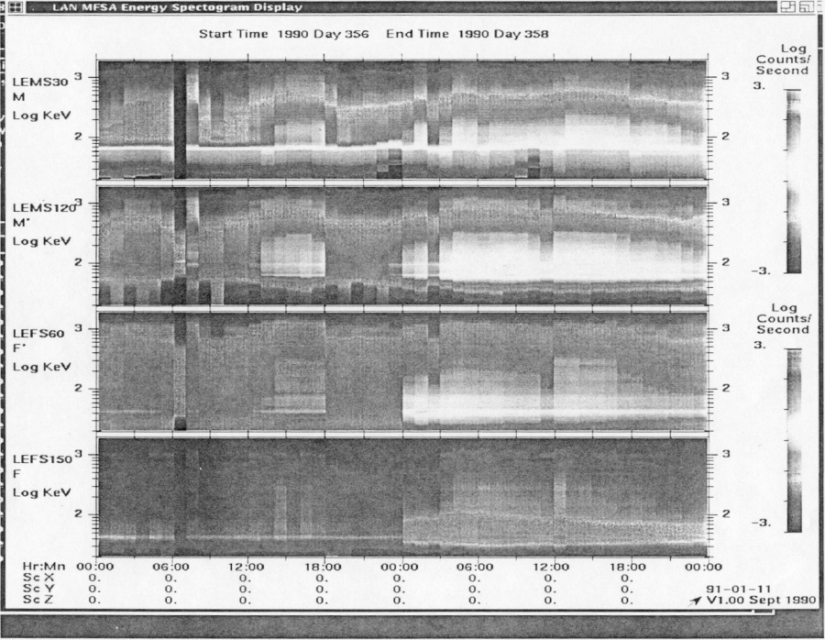
The MFSA energy vs. time spectogram is produced by program SPECTIME. The display format (Figure A16-10) contains four plots--one plot per detector. Each plot is organized as log energy (vertical scale) versus time (horizontal scale) and contains color encoded, spin averaged, normalized count rates for the time duration of the plot. The time duration of the plot is set by the user in the control file named SPECTIME.DAT located in the run-time default directory. The user is free to select any time duration (from seconds to days) per plot. The program will sequence through all plots contained within the user specified time bounds. Note that SPECTIME is suited for both event identification (days or longer per plot) and event analysis (minutes or seconds per plot). In addition to the duration of each plot, the user specifies the color scaling and energy ranges in the control file SPECTIME.DAT. The control file contains the following records and fields:
Table A16-5 Definition of SPECTIME.DAT
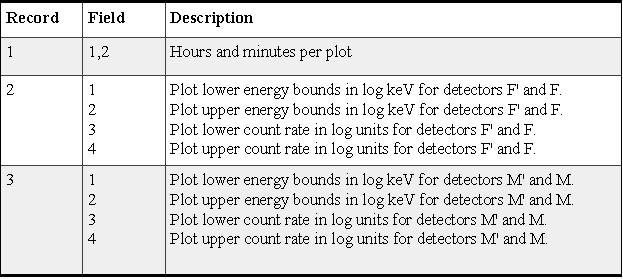
Figure A16-10 Sample SPECTIME plot
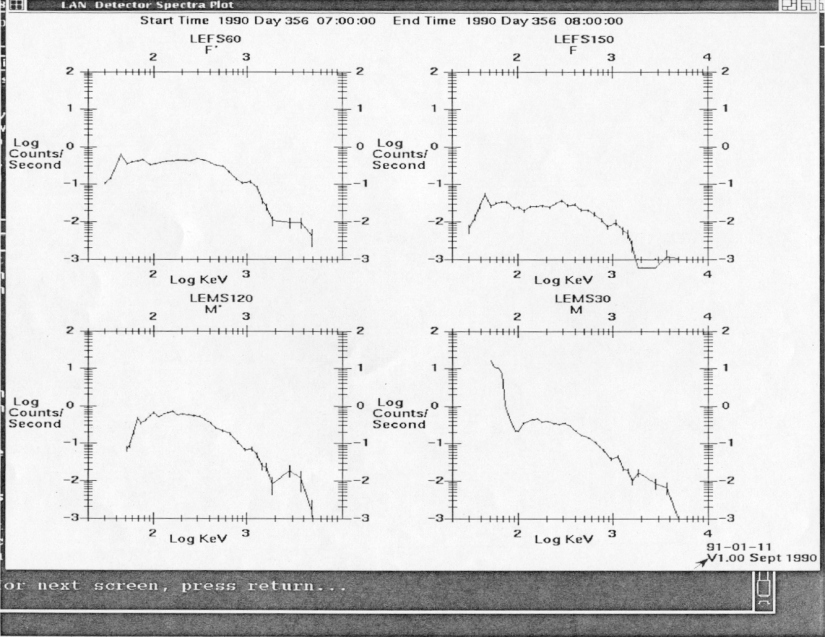
The MFSA spectra plot is produced by program SPECPLOT. The display format (Figure A16-11) consists of four spectra plots - one for each detector. Each plot is organized as log count rate (vertical scale) versus log energy (horizontal scale) and contains normalized sectored count rates for the detector. Currently color is used to identify sector. One plot is generated for each record within the user specified time bounds contained in the MFSA file. The user specifies the plot bounds using the control file SPECPLOT.DAT. The control file contains the following records and fields:
Table A16-6 Definition of SPECPLOT.DAT
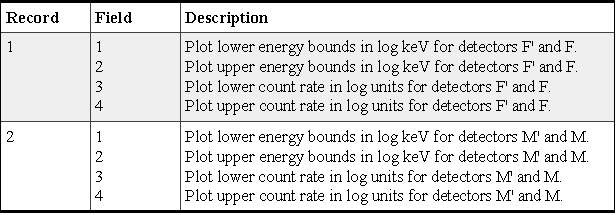
Figure A16-11 Sample SPECPLOT output
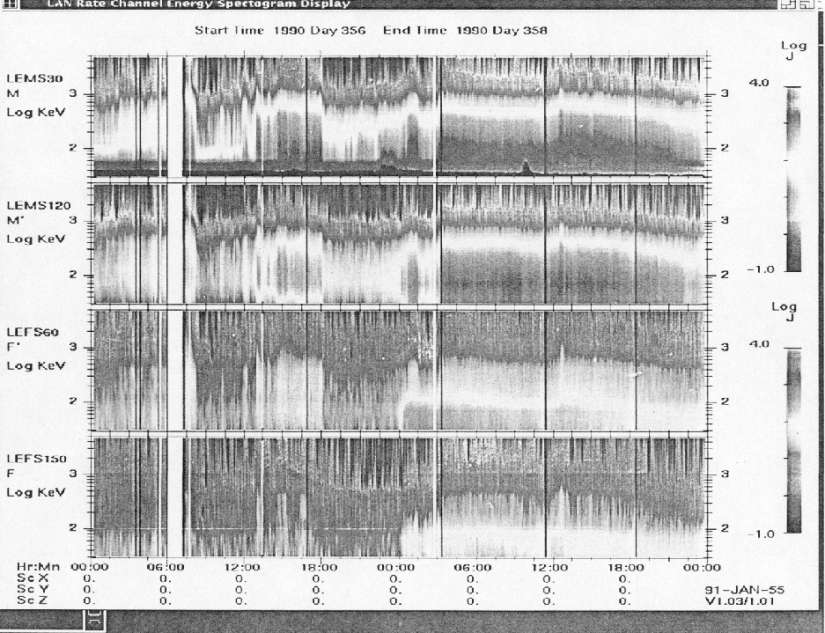
The rate channel energy vs. time spectogram is produced by program LANSPECT. The display format (Figure A16-12) contains four plots - one plot per detector. Each plot is organized as log energy (vertical scale) versus time (horizontal scale) and contains color encoded, spin averaged, rate channel count rates for the time duration of the plot. The time duration of the plot is set by the user in the control file named LANSPECT.DAT located in the run-time default directory. The user is free to select any time duration (from seconds to days) per plot. The program will sequence through all plots contained within the user specified time bounds. Note that LANSPECT is suited for both event identification (days or longer per plot) and event analysis (minutes or seconds per plot). In addition to the duration of each plot, the user specifies the color scaling and energy ranges in the control file LANSPECT.DAT. The control file contains the following records and fields:
Table A16-7 Definition of LANSPECT.DAT
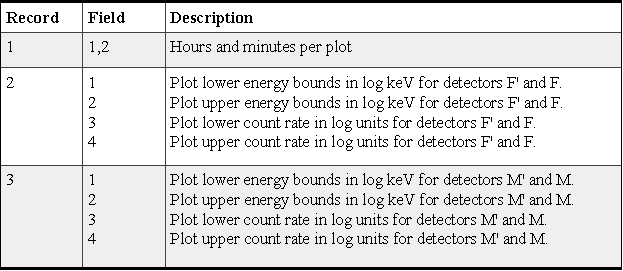
Figure A16-12 LAN rate channel energy spectogram display
Next: A16.6 Track Files -- A Major Revision
Return to Appendix 16 Table of Contents
Return to HISCALE List of Appendices
Return to Ulysses HISCALE Data Analysis Handbook Table of Contents
Updated 8/8/19, Cameron Crane
QUICK FACTS
Mission End Date: June 30, 2009
Destination: The inner heliosphere of the sun away from the ecliptic plane
Orbit: Elliptical orbit transversing the polar regions of the sun outside of the ecliptic plane