


Ulysses HISCALE Data Analysis Handbook
A17.1 Logarithmic Amplifier Thermal Compensation
Document Reference: D. E. Fort, September 13, 1983
Thermal vacuum testing of the MEPA energy board revealed a thermal drift problem in the logarithmic signal processing channels. The source of the problem was ultimately traced to the physical configuration of components and thermal conduction paths. Since similar configurations were used in the EPD experiment on Galileo and the LAN experiment on Solar Polar, the drift may be encountered in those instruments as well. The following is a description of the problem and a possible solution.
Figure A17-1 is a simplified schematic of a logarithmic signal processing channel. The key elements for the purpose of this discussion are the logarithmic amplifier U1, and the temperature compensating sensistor Rt.
Figure A17-1 Log channel
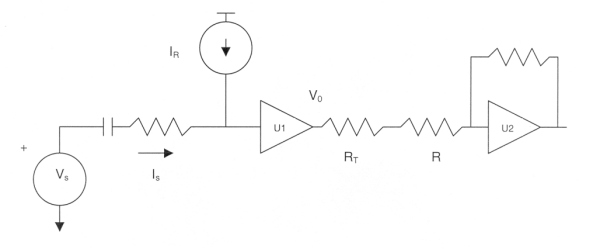
The basic equation of response for U1 is as follows:
V0 = kT/q ln (1 + IS/IR) (1)
| where: | k = Boltzmann constant = 1.38 x 10⁻²³ joule/ºK |
| q = electron charge = 1.6 x 10⁻¹⁹ coul | |
| T = temperature in ºK | |
| IS = signal current | |
| IR = reference current |
For IS/IR>>1, the output voltage is proportional to the logarithm of input excitation. Note, however, that it is also directly proportional to temperature. For this reason, heaters and heater control circuitry are included (not shown in Figure A17-1) to maintain U1 at a reasonably constant temperature near 25° C. In addition, a temperature sensitive resistor (sensistor RT) is installed in intimate thermal contact with U1 and selected so that its temperature drift will tend to cancel that of the log amp. The selection is made as follows:
| From Eq. 1: | DV0/DT = V0/T |
|
or |
DV0/V0 = DT/T |
Evaluating at room temperature (~=300° K) yields a temperature coefficient for the log amp of 0.33%/ °C. RT is chosen so that the signal driving the following gain stage is reduced by the same percentage.
The TG 1/8 (Texas Instruments) sensitors have a T.C. of approximately 0.7%/ °C which can be reduced to the required value by placing it in series with a fixed resistor of equal value.
A17.1.3 Thermal Vac Test Results
Figure A17-2 is a plot of the response of the log channel at two background temperatures. The background temperature was monitored on the ground plane of the P.C. board near the log amp. The log amp case temperature was controlled to +25°C throughout the test. The test was conducted in vacuum to eliminate possible effects of moisture and air currents.
Figure A17-2 Thermal vac test results for log E channel
Figure A17-2 shows a definite change of slope in the log response and possibly indicates a translation as well, corresponding to an equivalent change of input level on the order of 10%. Following extensive testing to ensure that the input level and reference current were not the problem, attention was focused on the log amp/sensistor combination. A calculation showed that the observed shift in response (~10%) could result if it were assumed that the sensistor did not track the log amp temperature but instead gradually developed a 5°C differential as the background temperature was lowered. The direction of the shift implies that the sensistor became cooler than the log amp.
Figure A17-3 is an illustration of the physical configuration of sensistor and log amp. The sensistor is encased in a glass package and is affixed to the metal hybrid case with delta bond adhesive. In view of the above calculations, it was hypothesized that sufficient conductive heat loss via the sensistor leads, coupled with sufficient hybrid/sensistor thermal resistance due to the glass package, could cause the temperature of the sensistor to fall approximately 5°C under the test conditions.
Figure A17-3 Log amp/sensistor configuration
A17.1.5 Modification and Retest
Figure A17-4 shows the modifications which were made in an attempt to alter the thermal configuration. This modification was intended to (1) increase the thermal resistance of the leads and (2) further isolate the sensistor from the board by holding a portion of the leads in thermal contact with the hybrid case.
A retest under the same thermal vac conditions revealed thermal drift on the order of 1 mV, an order of magnitude improvement.
Figure A17-4 Thermal configuration modifications
A17.1.6 Additional Observations: The Breathing Effect
Figure A17-5a indicates a typical histogram of signal amplitude as obtained on a pulse height analyzer (PHA) while log amp heaters were cycling on and off to maintain the case temperature at +25°C. Figure A17-5b is the histogram obtained at room temperature conditions (heaters off).
 |
 |
| Figure A17-5a PHA width at 25º C (heaters on) |
Figure A17-5b PHA width, heaters off |
When the heater turned on, the narrow peak of Figure 5b (accumulatin essentially in a single channel of the PHA) could be seen to slowly shift upward to adjacent channels. Accumulation was still in essentially one channel at a time. After a total upward shift of approximately 5 channels (5 mV), the peak would slowly drift back to its starting point during the time the heater was off, and the cycle would be repeated. Accumulation over many such cycles produced the histogram of Figure 5a, and because of its rhythmic nature, the process was dubbed the "breathing effect." It is hypothesized that this drift is due to the built-in hysteresis of the bang-bang heater system (~2°C) combined with a relatively long thermal time constant between the hybrid case and sensistor as compared to the time constant between the case and the internal logarithmic elements. The effect of the hysteresis is to provide a small temperature swing about the set point, and the effect of the long time constant is to sufficiently isolate the sensistor so that the first order thermal compensation is not completely effective during the heater cycle time. (A typical time constant for the TG 1/8 sensistor is 35 seconds). It is presumed that the breathing effect can be reduced by decreasing heater hysteresis (ideally to zero by using a proportional heater). No practical method for changing the time constant is available.
The logarithmic channels in the MEPA instrument must be physically reconfigured as shown in Figure A17-4 to reduce the heat loss in the sensistor leads to acceptable levels. In addition, the hysteresis of the bang-bang heater used to maintain the hybrid case temperature at +25°C will be decreased from 2°C to 1°C.
Next: A17.2 LAN Spare - LEMS/LEFS LINEAR Offset vs. Temperature
Return to Appendix 17 Table of Contents
Return to HISCALE List of Appendices
Return to Ulysses HISCALE Data Analysis Handbook Table of Contents
Updated 8/8/19, Cameron Crane
QUICK FACTS
Mission End Date: June 30, 2009
Destination: The inner heliosphere of the sun away from the ecliptic plane
Orbit: Elliptical orbit transversing the polar regions of the sun outside of the ecliptic plane