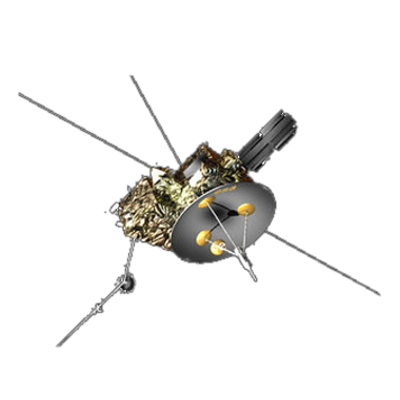
Ulysses HISCALE Data Analysis Handbook
Appendix A: PI Comments/Explanations and Caveats
Appendix A 7 (URAP/STO Experiment)
The Unified Radio and Plasma Wave Experiment (URAP) provides electric field data from DC to 1 MHz and magnetic field data from 0.2 Hz to 448 Hz. The URAP CDF parameters cover the frequency range from 10 Hz to 32 kHz for electric field; the Radio Astronomy Receiver data, most of the magnetic field search coil data, and the sounder spectra have not been included.
From the URAP CDF parameters, the user can identify periods of intense electric wave activity in the frequency regimes corresponding to electron plasma oscillations (Langmuir waves) at the plasma frequency fp (kHz) = 9 * sqrt(electron density in cm3), as well as electric wave activity at lower frequencies (ion acoustic waves, etc.). These waves are usually observed upstream of interplanetary shocks and planetary bow shocks. They are also associated with other transients in the solar wind. The annotated plots that follow indicate the occurrences of plasma waves associated with several discontinuities in the solar wind, as well as some of the artifacts in the data that should not be mistaken for physical events. Note that not all URAP CDF parameters are included in these plots. A plot of the solar wind plasma (BAM) and magnetic field (HED) data is also attached for comparison; for example, the intervals of wave activity at the beginning of Jan. 20 and Jan. 22, 1993, are associated with the passage of shocks at the leading and trailing edges of a corotating interaction region (CIR).
AVERAGE AND PEAK ELECTRIC FIELD (ELF and VLF)
The peak values for both the ELF and the VLF data are weighted by the reciprocal of the associated average values during the averaging window. This weighting was performed to reduce the effects of noise in the peak values. It means that the CDF peak value data are not the instantaneous peak values. Users requiring accurate peak value data should contact the URAP PI.
In the ELF peak data, 0 is a legitimate value. This occurs when the physical signal does not exceed the onboard threshold, so that no value is acquired in the averaging interval. The average data associated with the same period are valid.
SCAN MODE AND BITRATE EFFECTS
The URAP CDF parameters are affected by the scan mode of one of the URAP instruments, the Plasma Frequency Receiver (PFR), which causes the large steplike backgrounds seen most clearly in the 100 to 500 Hz data. It is not practical or appropriate to remove this varying background. It has been the practice throughout the first several years of operation to alternate the PFR scan mode between "fast" and "slow" scan modes approximately once a day.
In addition, some of the background levels for the average values also depend on the telemetry bit rate. The combination of this effect and the PFR scan mode effect is to produce the 4 background levels shown for the ELF average data (most evident in 100500 Hz).
The average electric field data are the averages of all data values obtained in the averaging window (256 sec) for each frequency band.
SPURIOUS PEAKS AND DATA GAPS
There are regular but infrequent spurious values associated with sounder operation occurring during the "fixed tune" mode of the PFR, which usually occurs for 1 hour each day. These were not eliminated because the programming effort required was deemed to be excessive. The effects of sounder operations during normal PFR slow or fast scan operation are eliminated. VLF data is excluded from the CDF during daily PFR "fixed tune" operations which last approximately one hour. Descriptions of these modes can be found in the URAP instrument paper (see Ref. 3).
FES DATA AND FLAGS
The FES data are the maximum values obtained by the Fast Envelope Sampler (FES) during each 256 sec window. The FES provides high time resolution observations (up to 1.1 msec) for wave data acquired through a broad band filter. Two bands are provided; the interpretation of the bands and antennas for the "Upper" and "Lower" bands are given by the status flags. The "Upper" FES channel failed on approximately day 250 of 1991, and only the "Lower" band data are meaningful after that date. In addition, the FES provides high time resolution "events", which consist of the envelopes of the wave activity during approximately 1 sec "snapshots"; however, these data are not included in the CDF.
In general, the signal observed in the FES CDF data is the background level caused by one of the many sources of spacecraft noise. The background level is steplike and depends on the filter channel and antenna selected. Only events suggestive of sporadic plasma wave activity rising above the constant noise floors are physically significant.
The following section provides the interpretation of the FES flags:
Bit numbering convention: 7 is the least significant bit and bit 0 the most significant bit.
The status byte is set to zero during a sounding or calibration if the sounding or calibration completely covers the averaging interval.
Bit 0 indicates the B search coil input (relevant if Bits 12 = 10):
| Bit 0 | Input |
| 0 | By |
| 1 | Bz |
Bits 1 and 2 indicate the "Lower" band input:
| Bit 1 | Bit 2 | Input |
| 0 | 0 | Ex |
| 0 | 1 | Ez |
| 1 | 0 | B |
| 1 | 1 | cycling |
Bit 3 indicates the "Upper" input:
| Bit 3 | Input |
| 0 | Ex |
| 1 | Ez |
Bits 4 and 5 indicate the frequency of the "Lower" band if input is Ex or Ey. B data are always 10-600 Hz:
| Bit 4 | Bit 5 | Frequency |
| 0 | 0 | 2-20 kHz |
| 0 | 1 | 0.6-6 kHz |
| 1 | 0 | 0.2-2 kHz |
| 1 | 1 | .01-1 kHz |
Bits 6 and 7 indidcate the frequency of the "Upper" band:
| Bit 6 | Bit 7 | Frequency |
| 0 | 0 | 6-60 kHz |
| 0 | 1 | 2-20 kHz |
| 1 | 0 | 0.6-6 kHz |
| 1 | 1 | 0.6-6 kHz |
PI Caveats and Recommendations
1. The URAP CDF data should be used only to identify intervals of plasma wave activity and to determine the relative intensities in the broad frequency bands provided. The URAP PI should then be contacted to provide data products with higher frequency resolution and better calibration.
2. The user must use caution to avoid being misled by the effects of varying background levels caused by spacecraft noise and bit rate changes.
3. For the use of the CDF data, we have the following recommendations:
(a) Avoid averaging the data because averaging across 'step' boundaries or PFR "fixed tune" periods can be very misleading.
(b) Plot the data as individual points rather than connected lines. This prevents occasional spurious values from dominating the visual pattern.
(c) Remember that the stepping is always present even if there is enough activity that the transition is hidden. The URAP team can provide mode change information to assist in interpretation.
(d) In general, plotting more than several days per frame is not recommended.
4. As of June 1993, the CDF processing software was occasionally causing spurious large values in the ELF and VLF data that had been processed up to that time. The cause was still under investigation.
Dr. R. J. MacDowall, Lab. for Extraterrestrial Physics,
Code 695, NASA/GSFC, Greenbelt, MD 20771 (USA)
Tel. +1 301 286 2608;
Fax: +1 301 286 1683
Email: 15495::MACDOWALL
7 Jun 1993
Figures:
- Figure A3-1 Ulysses CDR--solar wind plasma and magnetic field - 98 244 Sep 1
- Figure A3-2 Ulysses CDR--solar wind plasma and magnetic field - 98 260 Sep 17
- Figure A3-3 Ulysses CDR--energetic particles, low energy ions and cosmic ray - 98 244 Sep 1
- Figure A3-4 Ulysses CDR--energetic particles, low energy ions and cosmic ray - 98 260 Sep 17
- Figure A3-5 Ulysses CDR--plasma wave - 98 244 Sep 1
- Figure A3-6 Ulysses CDR--plasma wave - 98 260 Sep 17
- Figure A3-7 Ulysses CDR--solar wind ion composition - 98 244 Sep 1
- Figure A3-8 Ulysses CDR--solar wind ion composition - 98 260 Sep 17
Next: Appendix B: Acronyms
Return to Appendix 3 Main Table of Contents Page
Return to Ulysses HISCALE Data Analysis Handbook Table of Contents
Updated 8/8/19, Cameron Crane
QUICK FACTS
Mission End Date: June 30, 2009
Destination: The inner heliosphere of the sun away from the ecliptic plane
Orbit: Elliptical orbit transversing the polar regions of the sun outside of the ecliptic plane


