


Ulysses HISCALE Data Analysis Handbook
4.8.1 Preflight Calibration with Electron Beams
Pertinent engineering and technical reports on calibrations are reproduced here for the record.
Document Source: John W. Kohl and John H. Crawford
(LAN-67-81)
Date: 8-12 September 1981
INTRODUCTION
The Solar-Polar Engineering Model LAN-2B Telescope detector head was calibrated with electrons at the NASA Goddard Space Flight Center low-energy accelerator. Electron energies ranged from 30 to 140 keV, with extensive scans taken at 40 and 100 keV. Because of the availability of the flight electronics, these initial calibrations were made with laboratory electronics. For these initial tests, detectors B, M, and F were monitored.
In general, the test results indicate that the detection efficiency of deflected electrons in the B detector can be as high as 75% depending on the electron beam target, angle, and energy. Also at electron energies up to 140 keV the largest efficiency for electron contamination of the M detector was 1.7 % for all beam targets and angles. Electron detection efficiency as a function of energy for normal incidence was also obtained for the F detector.
EXPERIMENTAL SET-UP
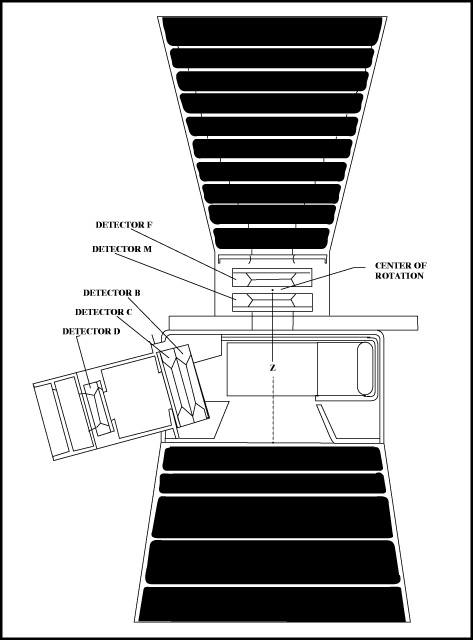
The International Solar Polar Mission (ISPM) LAN-2B telescope detector head was installed in the target chamber of the NASA Goddard Space Flight Center low energy electrostatic accelerator on 8 September 1981. It was mounted by the telescope mounting foot to a rotation plate parallel to the baseplate of the vacuum chamber. Because of this mounting method, the magnets were at an angle of 55.17° to the axis of rotation and 34.83° to the plane of rotation. The center of rotation was mid-way between Detectors M and F. Referring to Figures 4.57 and 4.58 might assist in understanding the geometry.
Figure 4.57 Orientation of LAN2B magnet in electron beam
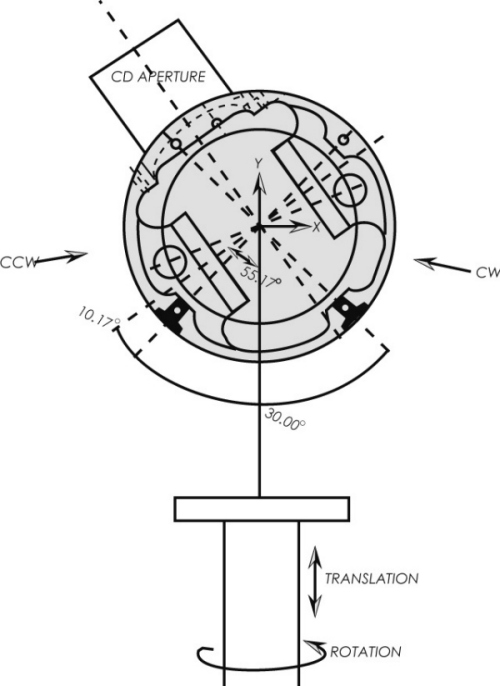
Figure 4.58 Schematic ISPM LAN2B telescope
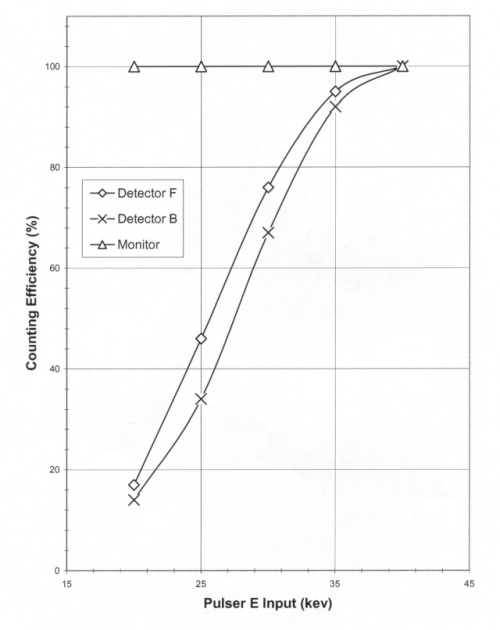
The tests presented in the next section were obtained using standard NIM laboratory electronics. The discriminator levels on the scalers were set just above the noise level--to give a backround count rate of approximately one count per second. The 50% discrimination levels were then checked with a pulser calibrated with the 59 keV X-ray line for Am 241. The resulting discrimination levels can be obtained from Figure 4.59 as <20 keV, 25.5 keV, and 27.5 keV for the monitor, F, and B detectors respectively. Detector M, not shown, had a half-trigger level of 30 keV.
Figure 4.59 Determination of electronic counting thresholds using a calibrated pulser
For all the accelerator runs discussed in this report, there was a 0.050 inch diameter aperture in the beam line, approximately 2 inches in front of the LAN-2B collimator.
TESTS AND RESULTS
In general the test data was obtained by taking a beam monitor reading both before and after taking a LAN-2B detector reading to insure that beam intensity variations were not excessive. Beam intensity variations were on the order of 3 to 5%, which is about normal for this accelerator.
1. Electron Sweeping Energy: This was a test to determine the electron contamination in the LEMS M detector as a function of energy. For target positions of X = 0 and Z = 0, Y was varied from Y = +.75 to Y = -.75 inches in 0.25 inch steps. For each of these target positions an angular sweep of approximately 30° around the center line was made. For electron beams of 100 keV and 140 keV the peak efficiency for contamination of the M detector was 0.56 and 1.7% respectively. Both peaks occurred in the same target position, i.e. Y = -0.25 inches and q = 15° CCW. If one then sights along this line, it looks as if the electron beam might be striking a pole piece of the sweeping magnet.
2. Deflected Electron Efficiency: This was a test to determine the electron detection efficiency in the deflected electron detector, B, as a function of target position, beam angle and energy. Again, for target positions of X = 0, Z = 0, Y was varied from Y = +.75 inches to Y = -.75 inches in 0.25 inch steps. At each such target position an angular sweep of q = ±30° from center was made. Such a thorough sweep was made at only two electron beam energies; one low energy, 40 keV, and one high energy, 100 keV. The results of these angular sweeps can be seen in Figures 4.60 and 4.61. Then with the beam target set at X, Y, and Z = 0, an angular sweep was made at various energies from 30 to 140 keV to determine the angular response and efficiency of the peaks. In each case, once the peak was located, only a few data points around the peak were recorded. The angular responses at various energies are shown in Figure 4.62. There seems to be no consistent indication of the peaks marching across the graph as a function of energy. This is probably due to the geometry of the orientation of the LAN telescope with respect to the beam.
- Figure 4.60 LAN2B B detector electron detection efficiency, energy = 40 keV
- Figure 4.61 LAN2B B detector electron detection efficiency, energy = 100 keV
- Figure 4.62 Lan2B angular location of B peak efficiency
3. Energy Loss in the Foil: For this test LAN-2B was rotated 180° with respect to the beam direction such that the beam was entered the LEFS collimator. The target was X, Y, and Z = 0. Detector F was monitored; both the scaler count rate and the energy deposited, with a pulse-height-analyzer, were recorded. Electron energy deposited in the F detector as a function of electron beam energy input to the LEFS telescope is shown in Figure 4.64. It can be seen that electron energy loss in foil 3B varies from 9 keV to 11 keV for 100 and 40 keV respectively. The thickness of foil 3B was measured using the attenuation of 5.9 keV X-rays from Fe55 to be 1.87 mm thick.
- Figure 4.63 LAN2B B detector peak electron efficiency as f (energy)
- Figure 4.64 Electron energy deposited in detector F
Electron detection efficiency as a function of input beam energy is presented in Figure 4.65. The data points seem to be fairly consistent and indicate a 50% energy point of 45 keV. For an energy loss of 10 keV in the foil, it means that approximately 35 keV was deposited in the detector. Since at this energy, the counting electronics are approximately 95% efficient, the effect probably is not electronic.
- Figure 4.65 Electron detection efficiency of detector F LAN2B as f (energy)
Next: Memo #2, Additional Data Presentation to Solar-Polar LAN-2B Electron Calibration Report
Return to Chapter 4 Table of Contents
Return to Ulysses HISCALE Data Analysis Handbook Table of Contents
Updated 8/8/19, Cameron Crane
QUICK FACTS
Mission End Date: June 30, 2009
Destination: The inner heliosphere of the sun away from the ecliptic plane
Orbit: Elliptical orbit transversing the polar regions of the sun outside of the ecliptic plane