


Ulysses HISCALE Data Analysis Handbook
Chapter 5: Inflight Performance
5,2.2 Typical Signatures (continued)
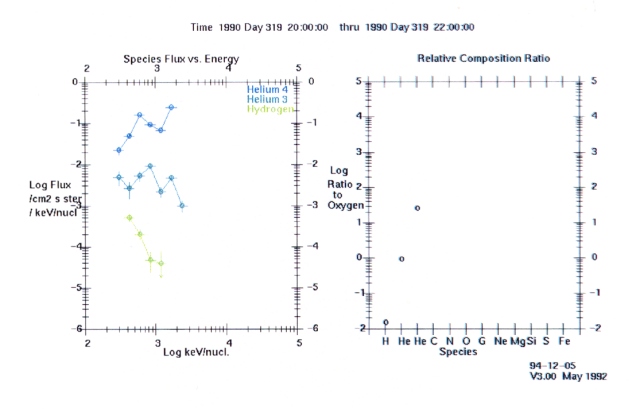
COMP Spectral Plot. The COMP program uses track files (e.g., trk90319.lan, produced by the routine PHAGEN) to make spectral plots for individual species. PHAGEN uses the file LANTRACKS00n.DEF to determine the counts in energy bins along each track; this is the data that is written in the track files. Figure 5.11 shows a COMP spectral plot for a two-hour period during the first calibration, including tracks for H, He3, and He4.
Note that the He3 track has never been calibrated, and does not measure He3; however, it has been included here as it does measure some of the scattered He4 particles. The left panel of Figure 5.11 shows the spectrum as measured during 2 hours of the first (90319) calibration. The two peaks in the top two (He) traces indicate the two alpha sources. The lower (H) trace shows scattered He particles that are counted as H at a level two or more orders of magnitude down. The right hand panel shows the composition ratio to oxygen. The peak in helium here should indicate the ongoing calibration. Anytime that the He flux is larger than that of H, one should be suspicious of the presence of the calibration source. The COMP program can also plot the spectrum for each sector; during the calibrations the sectors track each other well. Further analysis of the calibration response by sector is included in the PHA Analysis section below.
Figure 5.11 COMP spectrum and composition ratios
The TRACKDUMP program gives the number of counts in each bin along the track of requested species. Shown below is a portion of the TRACKDUMP output for helium for the same 2-hour period shown in the COMP spectra above.
| LAN PHA Track Rate Record | Begin time: 90 319 20 0 0 |
| End time: 90 319 22 0 0 |
| Bin # | 3 | 4 | 5 | 6 | 7 | 8 |
| Rate | 0.1615 | 0.7726 | 3.5550 | 2.9286 | 2.9606 | 15.5632 |
| N1 | 21.0 | 100.0 | 465.0 | 383.0 | 49.0 | 0.0 |
| T1 | 6682.5 | 6682.5 | 6682.5 | 66.82.5 | 6682.5 | 6682.5 |
| N2 | 0.0 | 0.0 | 0.0 | 0.0 | 333.0 | 2004.0 |
| T2 | 6682.5 | 6682.5 | 6682.5 | 6682.5 | 6682.5 | 6682.5 |
This output lists the counting rates in each He bin, as well as the counts and time in each relevant channel (here N1,T1 for channel W3; N2,T2 for W4). The peak number of counts occur in Bin 8 (1.41 2.0 MeV/n) which corresponds to the Cm peak (5.8/4 = 1.45 MeV/n). The Gd peak at 3.18 MeV (3.18/4 = 0.795MeV/n) appears in Bin 6 (.707 1.0 MeV/n), with spill-over to the lower energy bins.
Next: 5.2.2 continued (Time Plots from IDL_HS)
Return to Chapter 5 Table of Contents
Return to Ulysses HISCALE Data Analysis Handbook Table of Contents
Updated 8/8/19, Cameron Crane
QUICK FACTS
Mission End Date: June 30, 2009
Destination: The inner heliosphere of the sun away from the ecliptic plane
Orbit: Elliptical orbit transversing the polar regions of the sun outside of the ecliptic plane