


Ulysses HISCALE Data Analysis Handbook
Chapter 5: Inflight Performance
The MFSA (M and F Spectrum Accumulator) records contain sectored data with 32 energy channels covering the same energy range that the rate channels cover in 8 channels. These records provide more energy resolution than the rate channels. In this section we provide some typical MFSA calibration responses as seen in the team standard MFSA software. For reference, sector averaged rates in the 32 MFSA channels measured during the cover-closed times of two calibrations are included as Tables 5.16 and 5.17. The listings are outputs from plot_spect in Tappin's IDL_HS. The column containing the energy bands is only roughly accurate, being based on preliminary estimates. Figure 5.20 shows a superposition of the MFSA count rate spectra for the five calibrations to date. These plots were made with Tappin's IDL_HS, using the plot_spect option. The two upper panels show spectra for the F and F heads which do not have covers, and would not be expected to be affected by the calibrations. The increase in the highest channel of F during three of these calibrations is not understood at this time. The two lower panels show the M' and M heads that have sources in the covers. The reproducibility of these count rates traces over these four years is quite good.
- Table 5.16 MFSA spectral dump output 90319, 2010-2210
- Table 5.17 MFSA spectral dump output 94091, 1030-1330
Figure 5.20 Thirty-two channel spectra for 5 calibrations
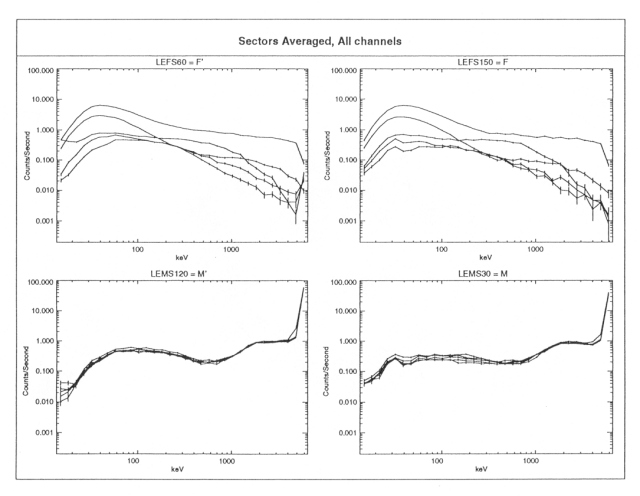
Figure 5.21 is an output from Chip Townsend's SPECPLOT program during the time the covers were closed for the 94091 calibration. The flux J is in units of ( cm2 s sr /keV)-1. The layout is similar to the Tappin output, but in this case we have plotted flux for all the sectors, and have superimposed the appropriate rate channels. Despite the fact that only preliminary energy values for the MFSA channels are available, and that the MFSA channel outputs are not normalized to the rate channels, the agreement between the MFSA and the rate channel fluxes is excellent. The peaks at ~2 MeV in the M' and M spectra are not understood; the small peak at ~35 keV in the M spectrum is thought to be an artifact due to incorrect energy bin widths in this region.
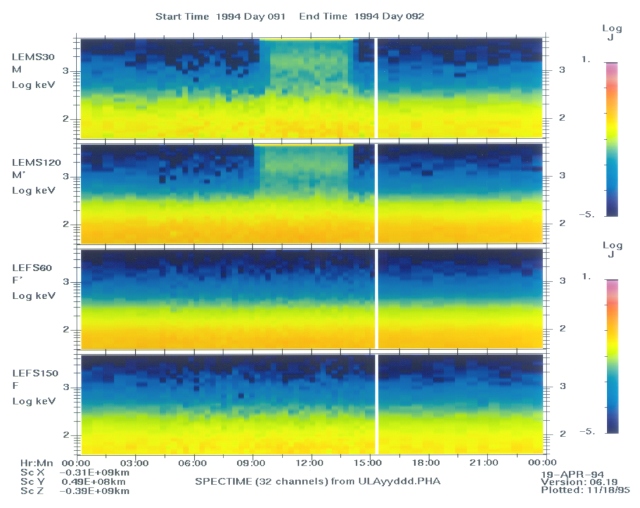
SPECTIME is a program which will plot a dynamic spectrum in the manner of LANSPECT (see Figure 5.10) but using the 32 MFSA channels instead of the rate channels. The most recent version can use the ULAyyddd.PHA files as input, so as to get the best time resolution available. (Previous versions required a time-averaged intermediate file as input.) An example of the output of this program is shown in Figure 5.22, for the entire day 94091. The calibration can be seen from about 1000 to 1330 UT in the top two (LEMS) panels.
Figure 5.21 PHA matrix for 92049 calibration
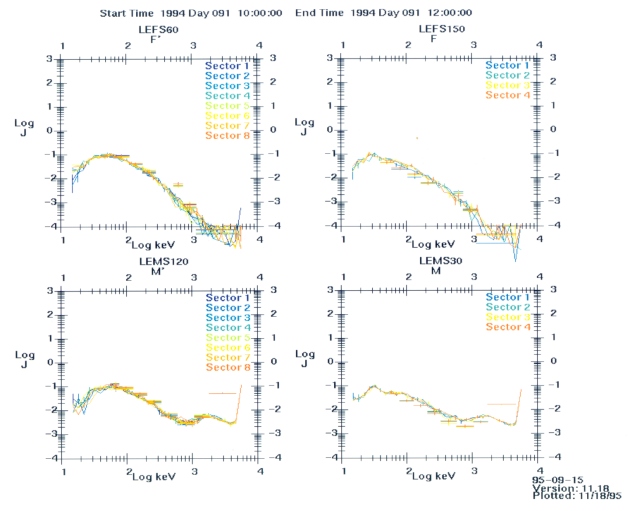
Figure 5.22 SPECTIME output for 94091
Return to Chapter 5 Table of Contents
Return to Ulysses HISCALE Data Analysis Handbook Table of Contents
Updated 8/8/19, Cameron Crane
QUICK FACTS
Mission End Date: June 30, 2009
Destination: The inner heliosphere of the sun away from the ecliptic plane
Orbit: Elliptical orbit transversing the polar regions of the sun outside of the ecliptic plane