ULYSSES In Space


Sun Banner
ULYSSES

Ulysses HISCALE Publications and Presentations


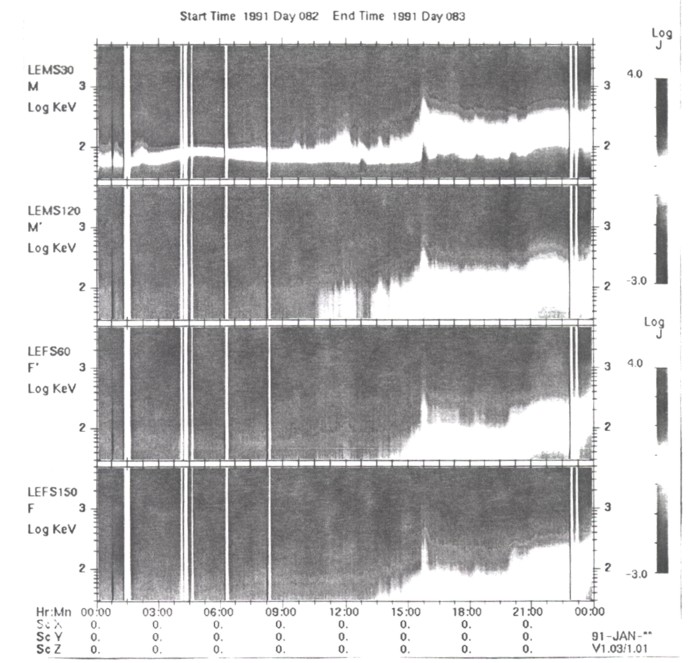
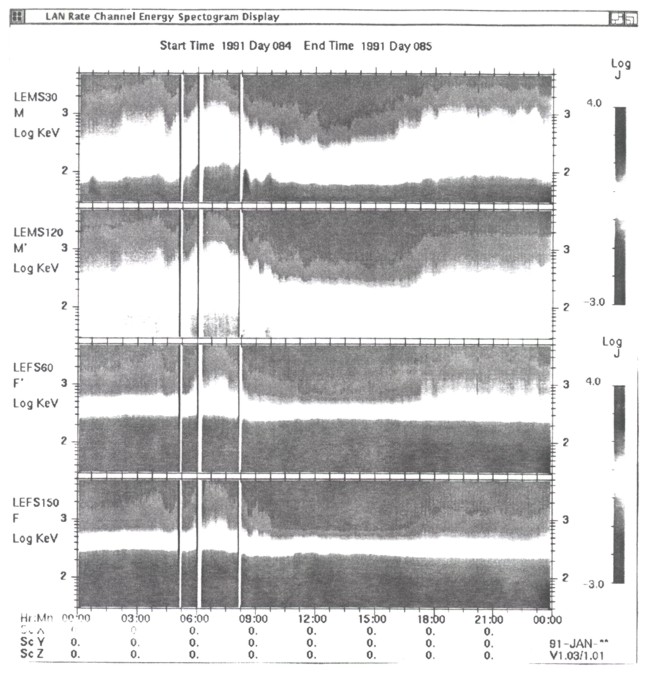
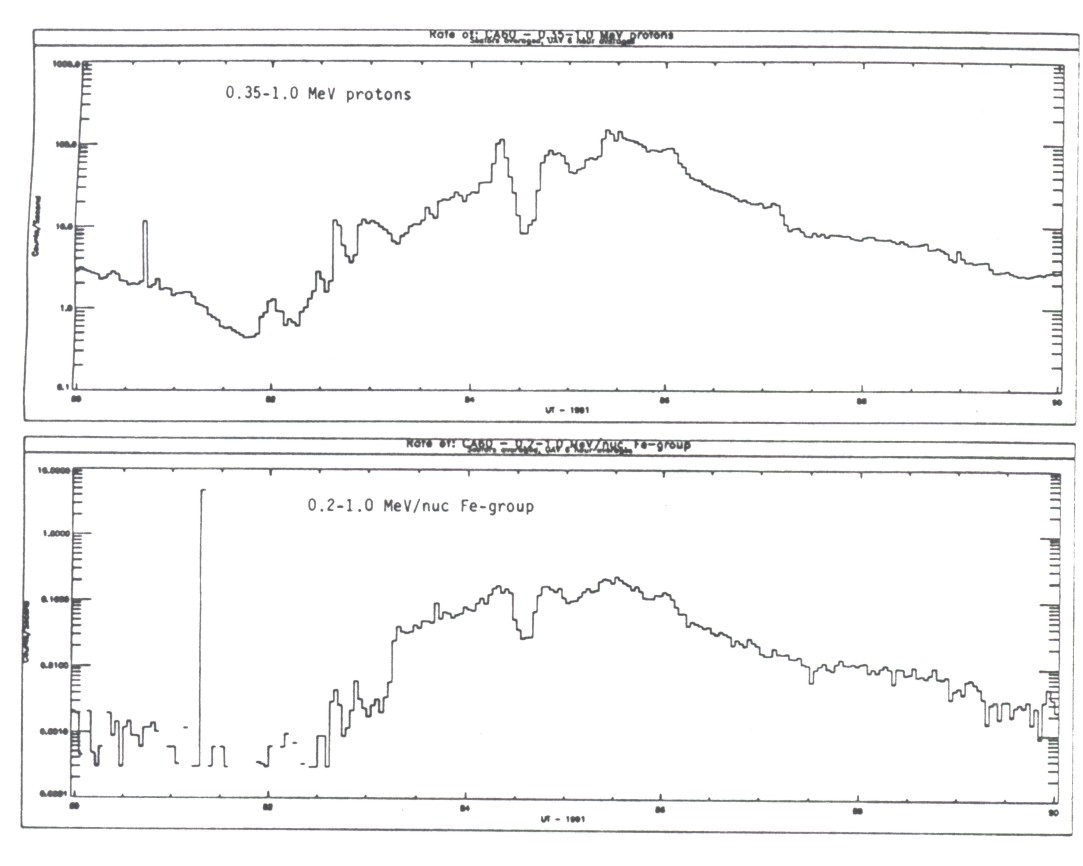
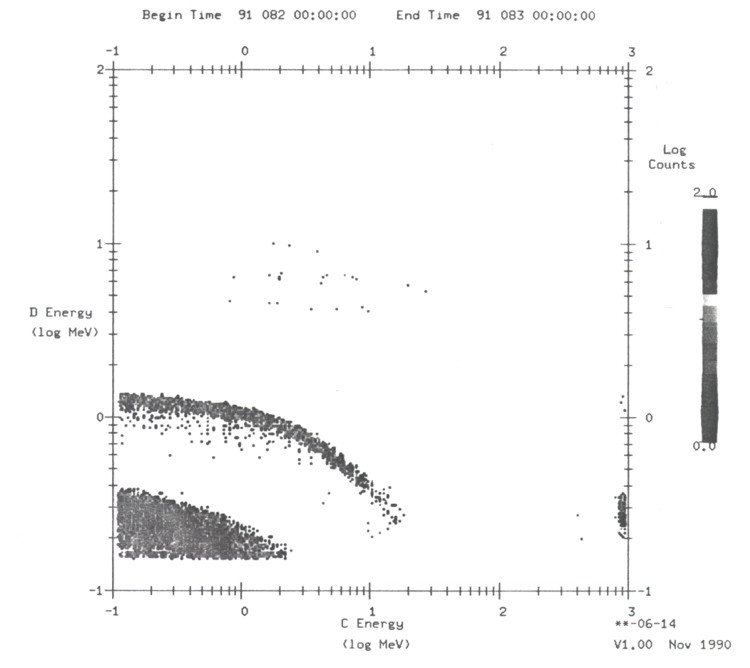
Low Energy Ion and Electron Measurements Beyond 2 AU on the Ulysses Spacecraft


Authors: C. G. Maclennan1, L. J. Lanzerotti1, R. E. Gold2, K. A. Anderson3, T. P. Armstrong4, R. P. Lin3, S. M. Krimigis2, M. Pick5, E. C. Roelof2, E. T. Sarris6, G. M. Simnett7, and W. E. Frain2

1AT&T Bell Laboratories, Murray Hill, NJ
2Johns Hopkins University Applied Physics Laboratory, Laurel, MD
3Space Sciences Laboratory, Univ. of California-Berkeley, Berkeley, CA
4Dept. of Physics & Astronomy, Univ. of Kansas, Lawrence, KS
5Observatoire de Paris, Meudon, France
6University of Thrace, Xanthi, Greece
7University of Birmingham, Birmingham, UK


Presented at: IUGG/IAGA '91, Session 4.4, "The Outer Heliosphere," Aug. 16, 1991, Vienna, Austria.


Figures:


Figure 1. The HISCALE experiment: complete instrument assembly. Figure 2. Schematic outline of detector telescope configurations in the two separate mechanical mounts.


Figure 3. Instantaneous look direction of the four LEMS/LEFS telescopes on the 4psteradian sphere. One spacecraft rotation (~12 sec) takes each telescope through 360°, and thus the entire sphere is covered each rotation.


Figure 4. Block diagram of electronics system for the HISCALE experiment.


Figure 5. Calibration data. Energy-loss matrix for the composition aperture for various incident ions. The solid lines outline the discrete element groups detected (Table 3).


Figure 6.Spectrograms of the ion and electron intensities measured by the HISCALE instrument for days 80-90, 1991. This interval occurred at the end of March 1991 when a large solar particle event swept over Ulysses.
Figure 7. Spectrograms as in Fig. 6 for day 82 at the beginning of the solar event. The interplanetary shock at ~1540 can be clearly seen. Figure 8.Spectrograms as in Fig. 6 for day 84 in the middle of the solar event.


Figure 9. Time-intensity counting rate plots of proton and iron group channels from the spectrum analyzer for days 80-90, 1991.
Figure 10. Ion flux composition matrix measured by the CA detector system during day 82, 1991, at the beginning of the solar event.
Figure 11. Ion flux composition matrix measured by the CA detector system during day 83, 1991. Figure 12. Ion flux composition matrix measured by the CA detector system during day 84, 1991.
Figure 13. Ion flux composition matrix measured by the CA detector system during day 84, 1991.    


Updated 8/8/19, Cameron Crane

QUICK FACTS

Manufacturer: ESA provided the Ulysses spacecraft, NASA provided the power supply, and various others provided its instruments.

Mission End Date: June 30, 2009

Destination: The inner heliosphere of the sun away from the ecliptic plane

Orbit:  Elliptical orbit transversing the polar regions of the sun outside of the ecliptic plane