Ulysses HISCALE
Publications and Presentations
Event at 2.5 AU
Authors: L.
J. Lanzerotti and C. G. Maclennan, AT&T Bell
Laboratories, Murray Hill, NJ; R. E. Gold and S. E.
Hawkins III, Johns Hopkins University Applied Physics
Laboratory, Laurel, MD; S. J. Tappin, Univ. of
Birmingham, U.K.; and R. Forsyth, Imperial College,
London, U.K.
Presented at: Sept. 1992 COSPAR
Meeting, Washington, DC.
Abstract. The
time evolution of the very large solar particle event
occurring on days 82-90 (March 23-31), 1991, as measured
at 2.5 AU by the instrumentation on the Ulysses
spacecraft was quite complex. Measurements by the
HISCALE instrument of the nuclear composition
(emphasizing Z ≥ 6) of the interplanetary particles at a
time resolution of two hours provides information on the
different interplanetary regions which swept over the
spacecraft. The Fe/O abundance ratio is found to differ
slightly in the regions before and after two tangential
discontinuities. The Fe/O abundance ratio is also found
to depend strongly on the energy/nucleon of the
particle, with values of ~0.7 for energies of for
energies of ~0.5-1.0 MeV/nucl. to values of ~0.2 for
energies ~8-16 MeV/nucl.


Figures:
 |
Figure 1.
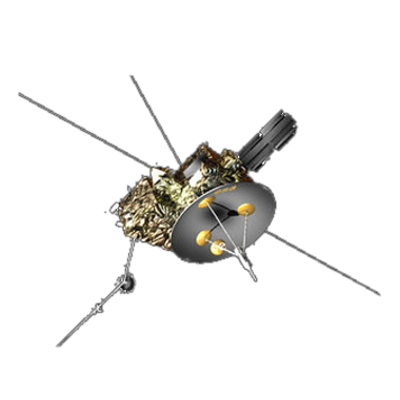
The HISCALE experiment: Complete instrument
assembly |
 |
Figure 2. Schematic
outline of detector telescope configurations in
the 2 separate mechanical mounts. The
composition data are acquired by the CA60
aperture. The detector coincidence conditions
are DCB. |
 |
Figure
3.Instantaneous look direction of the four
LEMS/LEFS telescopes on the 4π steradian sphere.
One spacecraft rotation (~12 sec) takes each
telescope through 360°, and thus the entire
sphere is covered each rotation.
|
 |
Figure 4. Calibration
data. Energy-loss matrix for the composition
aperture for various incident ions. The solid
lines outline the discrete delement groups
detected (Table 1). |
 |
Figure 5. Time-intensity
(2-hour average) counting rates for 3 Fe energy
channels and an O and a Ne-Mg-Si (NMS group)
energy channel for days 82-90, 1992.
Representative error bars are shown. |
 |
Figure 6. Ion
flux composition matrix measured by the CA
detector system during day 82, 1991, at the
beginning of the solar event. |
 |
Figure 7. Ion
flux composition matrix measured by the CA
detector system during day 83, 1991. |
 |
Figure 8. Ion
flux composition matrix measured by the CA
detector system during day 84, 1991. |
 |
Figure 9. Iion
flux composition matrix measured by the CA
detector system during day 85, 1991. |
 |
Figure 10. Details
of the onsets of the heavy ions on days 82-83,
1991. At the bottom are plotted the half-hour
averages of the interplanetary magnetic field
strength at Ulysses. The time of the first
interplanetary shock (S) and onset of the driver
gas (DG) are indicated. |
 |
Figure 11. Time
dependence of the 2-hour average Fe rates on day
84, 1991, during the time of the second
interplanetary shock (S) and the 2 tangential
discontinuities (TD). |
 |
Figure 12. Two-hour
average heavy ion spectra and atomic abundances
for several species, as well as atomic abundance
ratios (Z>6) relative to O for 2 different time
intervals in the event. The energy range for the
ratios C/O, N/O, S/O, Fe/O is 5-16 MeV/nucl.;
for G/O (NMS/O) the range is 1.0-1.0 MeV/nucl. |
 |
Figure 13. Energy
dependence of the Fe/O abundances for three
different MeV/nucl. channels. The times of
shocks (S), tangential discontinuities (TD), and
the driver gas (DG) are noted. |
 |
Figure 14. Sketch
of the interplanetary regions delineated by
examination of the heavy ion composition as a
function of time during the March 1991 event. |


