

Ulysses HISCALE Data Analysis Handbook
Appendix 2. User's Guide to LAN360
Document Reference: Carol G. Maclennan, Lucent Technologies, August 19, 1992
The following document describes the HISCALE analysis program LAN. It is intended for use by the programmers and scientists who are working with the HISCALE data. The reader is assumed to be reasonably familiar with the LAN experiment and its software, including the archive file and analysis routines such as LANSPECT and the IDL software developed by James Tappin (see Appendix 1).
The LAN experiment on Ulysses has four similar detector telescopes which, because of the spinning spacecraft, cover essentially 4p of the sphere (see Figure A2-1 below). The LEMS30 detector points at 30° to the spin axis and is divided into 4 sectors/spin; the LEFS60 and LEMS120 detectors point at 60° and 120°, respectively, to the spin axis and are divided into 8 sectors/spin; and the LEFS150 detector points at 150° and is divided into 4 sectors/spin. The LAN360 program was developed to take advantage of this 360° coverage in all the S/C (spacecraft) planes. A fifth detector telescope, the Composition Aperture (or WART) measures higher Z elements at 60° to the S/C spin axis. An option has been added to plot three WART channels on one page, in a similar format, for the X-Y plane (which is the only plane available for this data).
Figure A2-1 Look angles for the five detector telescopes for the LAN experiment.
Although the four detector telescopes are similar, they have different energy ranges and geometry factors; in addition the LEMS and LEFS detectors are sensitive to different types of particles. (Tables A2-1 and A2-2 in section A2.2 show the ranges of the channels available.) The LEFS are covered by a foil and the lower four channels are primarily used to measure electrons. The LEMS detectors count mainly protons, but are also sensitive to heavy ions. The LEMS and LEFS differences are discussed further in section A2.5.
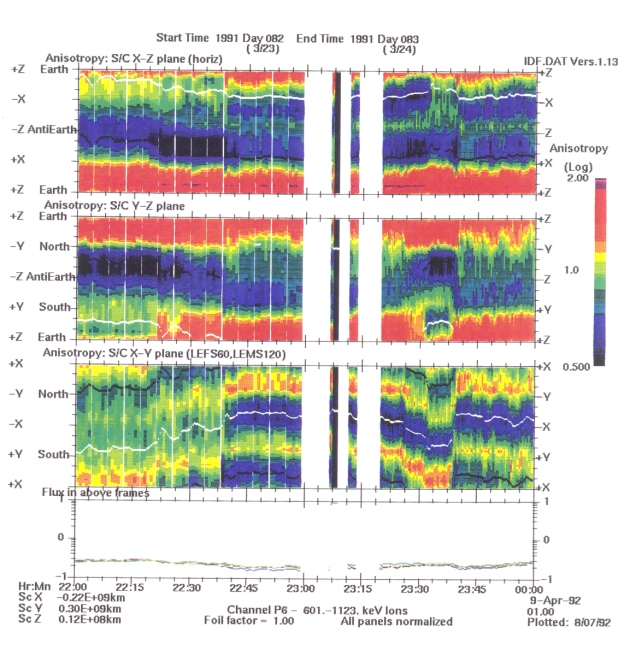
For the purposes of this program, anisotropy is defined as the ratio of the flux in a given direction to the average flux. In this sense, anisotropy refers simply to the variation of flux with direction and is not defined as it would be in theoretical plasma physics. The anisotropies are plotted vs time in a format similar to that of the program LANSPECT. The display format (Figure A2-2 below) contains 4 plots, the top three showing anisotropies in three planes in the spacecraft coordinate system. The bottom panel of the display shows a log plot of the average flux in the upper three panels (top to bottom, red, green, blue). The horizontal axis in all the plots is time and the plot duration is specified by the user. The input data can come from standard ULA rate files or from LANAVG (UAV) files. As with LANSPECT, the user can select any time duration (from seconds to days) per plot. The user also specifies time bounds, and the program will sequence through all the plots requested. Thus LAN360 is suitable for either overview plots for event identification or for event analysis.
Figure A2-2 LAN360 plot for channel P6 for hours 22-24 UT on day 82, 1991.
- A2.1 Description of Inputs
- A2.2 Available Channels
- A2.3 Anisotropy Calculation
- A2.4 Magnetic Field
- A2.5 LEMS and LEFS Differences
- A2.6 Other Features
- A2.7 Additional Information
Return to Ulysses HISCALE Data Analysis Handbook Table of Contents
Updated 8/8/19, Cameron Crane
QUICK FACTS
Mission End Date: June 30, 2009
Destination: The inner heliosphere of the sun away from the ecliptic plane
Orbit: Elliptical orbit transversing the polar regions of the sun outside of the ecliptic plane