


Ulysses HISCALE Data Analysis Handbook
Chapter 5: Inflight Performance
This section describes an analysis that was undertaken in IDL to better understand the SEEPHA matrix. Figure 5.18 shows a 3D plot of the matrix shown in Figure 5.9 made with the IDL routine shade_surf. The tallest peak corresponds to the Cm source. The peak corresponding to the Gd source is to the left of the Cm peak and towards the top of the figure. The large number of scattered He which are counted as H because of the priority scheme can be seen in the elongated peak in front of the Gd peak and in the peak to the right of the Cm peak.
Figure 5.18 PHA matrix for 92049 calibration
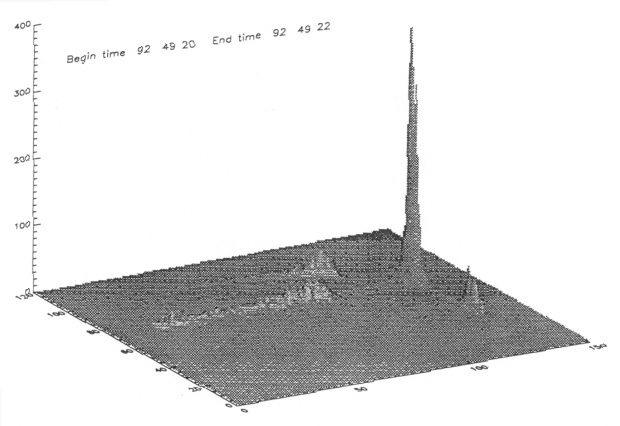
Figure 5.19 PHA matrix for 92049 calibration
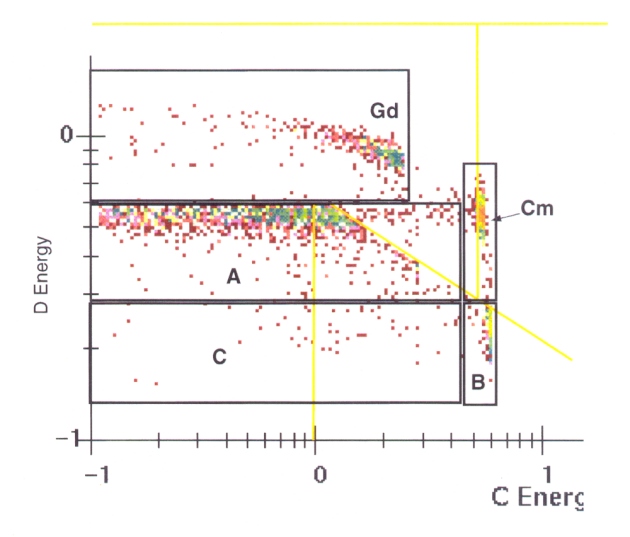
The matrix was divided into five areas as shown in Figure 5.19, and PHA matrix for 92049 calibration. Summations were made over each section to determine the number of counts in each region. It is difficult to draw many conclusions because of the distortions created by the priority scheme. However, one can compare the percentages in each area from one calibration to the next to verify that they don't change very much. This is done in Table 5.14.
Table 5.14 PHA counts/percentages
| Date/Time | CM peak | Gd Peak | Area A | Area B | Area C |
| 93019.20-22 | 3193/36.1 | 1375/15.6 | 3488/39.4 | 597/6.8 | 172/1.9 |
| 92009.22-24 | 2079/39.2 | 917/17.3 | 1875/35.3 | 386/7.3 | 42/0.8 |
| 92049.20-22 | 3705/42.1 | 1613/17.9 | 3034/33.7 | 578/6.4 | 65/0.7 |
| 93008.14-16 | 3652/41.5 | 1560/17.7 | 2979/33.8 | 538/6.1 | 50/0.6 |
| 94091.10-12 | 3540/39.2 | 1782/19.9 | 2997/33.4 | 575/6.4 | 46/0.5 |
Here the left column gives the time of the 2-h period during which the data in the table were accumulated. The table entries give the total number of counts in each of the areas delineated in Figure 5.19, followed by the percentage of the total counts that this represents. The number of counts during the 2h period of the 92009 calibration are about half those during the same length intervals during the other calibrations. This is because the spacecraft telemetry rate was a factor of 2 lower at this time. Another look at the same data can be had from the trackrate files with the program TRACKDUMP. Such a printout for 92049.20-22 is included as Table 5.15 (below). The PHA event counts in W4 (the high energy He channel) are slightly less than the counts found above in the Cm peak for this time. There are several hundred more counts in W3 than were found in the Gd peak. These were probably in the area of W3 that was included in Area A. There are more total PHA counts in W3 and W4 than in W1 and W2, but only 60% more, whereas the rate channels give a He/H ratio of 48:1; this is due to the PHA priority scheme described above. W4 (Cm peak) contains 64.1% of the total counts, W3 (Gd peak) contains 33.8%. The H channels (W1 and W2) each contain only about 1% of the rate counts. One can also check the distribution vs sector from this table: the minimum W4 rate channel counts in sector 8 are 12.4% of the total, the maximum in sector 4 is 12.6%. It is reassuring to look at the Undefined Event Counts and to see that practically all of the PHA event counts in channels W1 and W2 fall outside of the defined track bins. About 15% of the W3 counts are undefined; less than 6% of the W4 counts are.
Table 5.15 Track dump output 92049
| LAN PHA Track Rate Record | Begin time: 92 49 20 0 0 |
| End time: 92 49 22 0 0 |
PHA event counts
| Channel | Sector 0 | 1 | 2 | 3 | 4 | 5 | 6 | 7 | 8 |
| W0 | 9026 | 1128 | 1128 | 1128 | 1128 | 1128 | 1128 | 1128 | 1130 |
| W1 | 1383 | 165 | 160 | 170 | 165 | 181 | 171 | 196 | 175 |
| W2 | 2079 | 275 | 268 | 248 | 252 | 244 | 262 | 261 | 269 |
| W3 | 1890 | 245 | 242 | 248 | 214 | 232 | 239 | 232 | 238 |
| W4 | 3673 | 443 | 458 | 462 | 496 | 471 | 456 | 439 | 448 |
| W5 | 0 | 0 | 0 | 0 | 0 | 0 | 0 | 0 | 0 |
| W6 | 1 | 0 | 0 | 0 | 1 | 0 | 0 | 0 | 0 |
| W7 | 0 | 0 | 0 | 0 | 0 | 0 | 0 | 0 | 0 |
| W8 | 0 | 0 | 0 | 0 | 0 | 0 | 0 | 0 | 0 |
Rate channel counts
| Channel | Sector 0 | 1 | 2 | 3 | 4 | 5 | 6 | 7 | 8 |
| W0 | 256106 | 32300 | 31955 | 31884 | 32009 | 32168 | 31959 | 31966 | 31863 |
| W1 | 2099 | 260 | 250 | 247 | 248 | 277 | 254 | 292 | 267 |
| W2 | 3129 | 382 | 400 | 375 | 382 | 372 | 390 | 409 | 416 |
| W3 | 86568 | 11011 | 10878 | 10706 | 10721 | 10964 | 10665 | 10844 | 10776 |
| W4 | 164291 | 20645 | 20409 | 20555 | 20656 | 20544 | 20647 | 20419 | 20403 |
| W5 | 0 | 0 | 0 | 0 | 0 | 0 | 0 | 0 | 0 |
| W6 | 17 | 0 | 16 | 0 | 1 | 0 | 0 | 0 | 0 |
| W7 | 0 | 0 | 0 | 0 | 0 | 0 | 0 | 0 | 0 |
| W8 | 0 | 0 | 0 | 0 | 0 | 0 | 0 | 0 | 0 |
Undefined event counts
| Channel | Sector 0 | 1 | 2 | 3 | 4 | 5 | 6 | 7 | 8 |
| W0 | 0 | 0 | 0 | 0 | 0 | 0 | 0 | 0 | 0 |
| W1 | 0 | 165 | 159 | 169 | 165 | 181 | 169 | 195 | 173 |
| W2 | 0 | 275 | 268 | 247 | 252 | 244 | 262 | 261 | 269 |
| W3 | 0 | 45 | 22 | 26 | 25 | 36 | 34 | 29 | 30 |
| W4 | 0 | 38 | 16 | 21 | 22 | 18 | 22 | 16 | 15 |
| W5 | 0 | 0 | 0 | 0 | 0 | 0 | 0 | 0 | 0 |
| W6 | 0 | 0 | 0 | 0 | 1 | 0 | 0 | 0 | 0 |
| W7 | 0 | 0 | 0 | 0 | 0 | 0 | 0 | 0 | 0 |
| W8 | 0 | 0 | 0 | 0 | 0 | 0 | 0 | 0 | 0 |
Next: 5.2.4 MFSA Analysis
Return to Chapter 5 Table of Contents
Return to Ulysses HISCALE Data Analysis Handbook Table of Contents
Updated 8/8/19, Cameron Crane
QUICK FACTS
Mission End Date: June 30, 2009
Destination: The inner heliosphere of the sun away from the ecliptic plane
Orbit: Elliptical orbit transversing the polar regions of the sun outside of the ecliptic plane